What are Infographs? How to Create visually appealing Designs

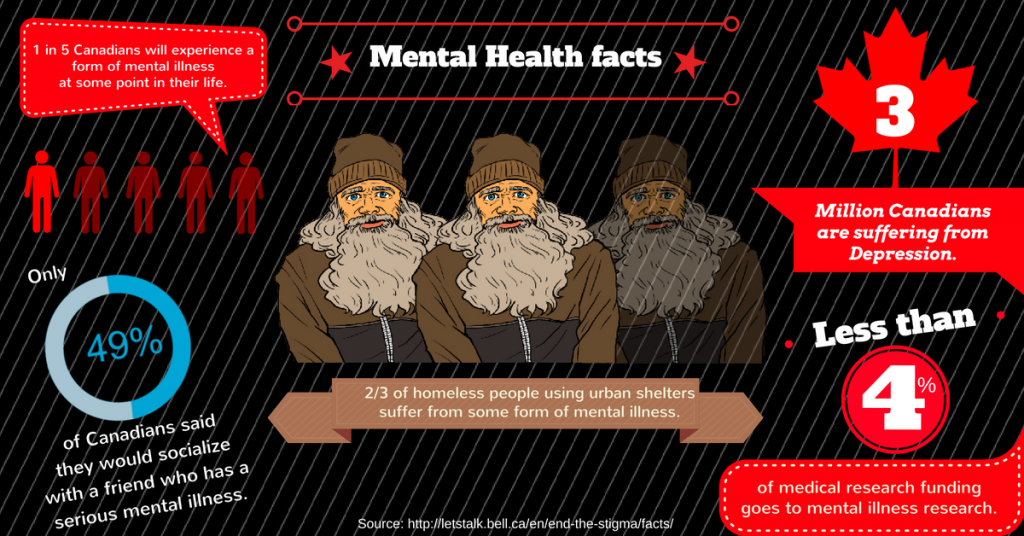
Mental Health Infograph
Infograph example

We are evolving with the way we read.

In this digital age that we live in today, we are constantly looking at information in a variety of ways. They are posted everywhere – in books, magazines, newspapers, billboards and more. In the last 10+ years, we have seen a marketing shift from traditional print to digital.  We consume information not only on our desktop computers and laptops, but now more than ever through our tablets and smartphones.  With the rise with Infographs, we can learn a lot more and absorb insightful information.

While many rely on traditional methods of reading and learning, Visual Communications has grown tremendously that provides a great deal of information retention.  But what exactly is Visual Communications?  Here is the Wikipedia definition in a nutshell:
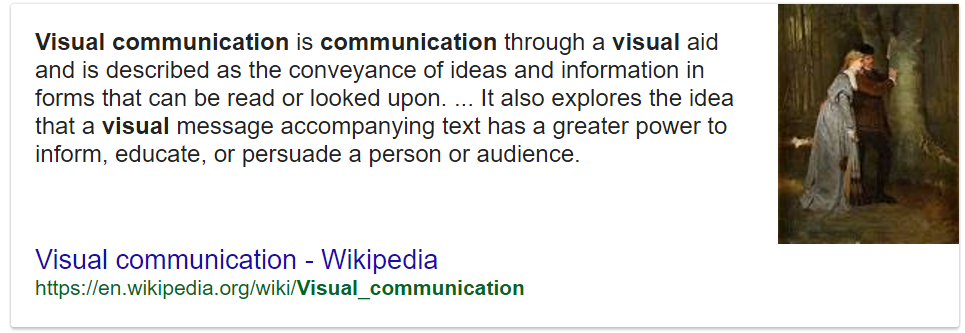
Visual Communication

The Rise of the Infograph

We are constantly looking for information to better our knowledge. With knowledge comes better learning outcomes, which means faster and easier ways to retain information.  Enter the Infograph, which is a visual image in the form of a chart or diagram that is used to present information and data. Check out some interesting stats on the benefits of having Infographs:

  • High quality infographics are 30x more likely to be read than text article
  • 40% of people respond better to visual information than text
  • Infographs help increase SEO, which results in higher search engine rankings and more visitors to your website
  • 36.4% click on the first link
  • 12.5% click on the second link
  • 9.55% click on the third link
  • They are simply more engaging
  • Helps you process information faster
  • Researchers found that color visuals increase willingness to read by 80%
  • People remember 80% of visuals that they see rather than 20% of what they read
  • Infographics can keep customers on your website longer

Infographs are visibly more appealing and are easier to the common eye. Anyone with a Photoshop like program can get in the fun and create their own.  In recent years, a company like Canva has made it easier than ever to produce quality designs and share online. You don’t have to be professional graphic designer anymore to build a great visual communication.

5 Helpful Tips on designing a great Infograph

1) Create your infographic for your target audience
2) Strive for simplicity
3) Use imagery and less text
4) Use white space, not a distracting background
5) Build to share on social media platforms

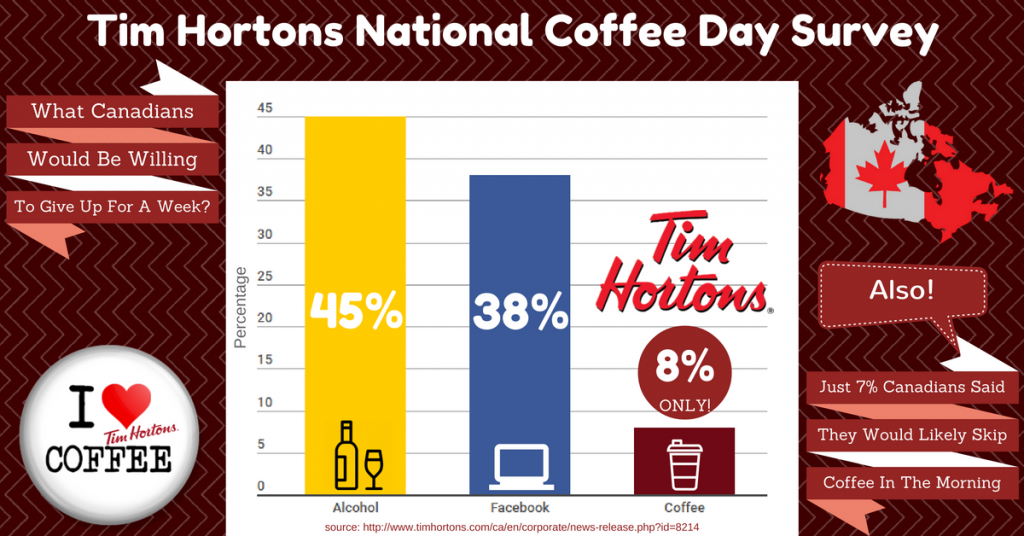
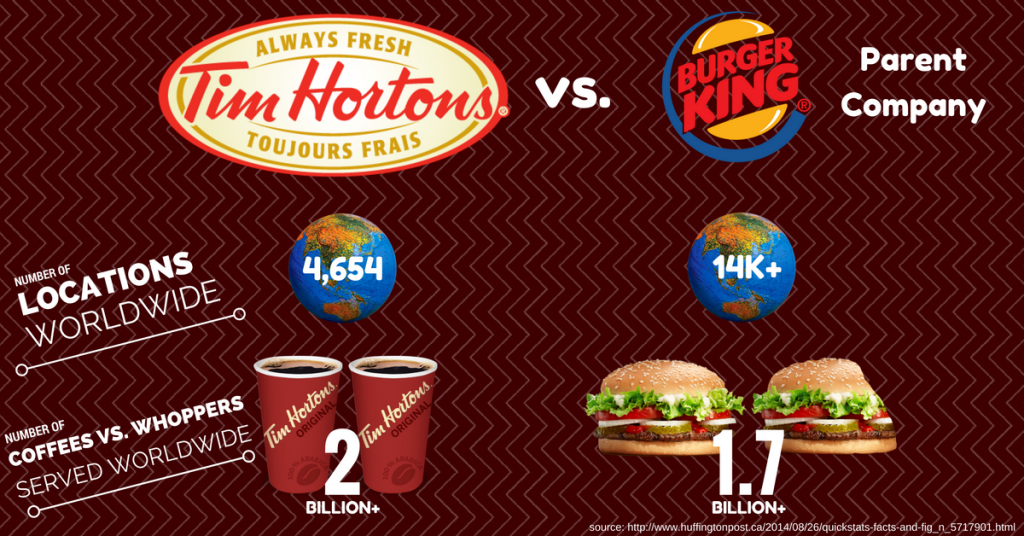
Having that said, check out five Infographs that I have put together, with Tim Hortons as the subject matter.
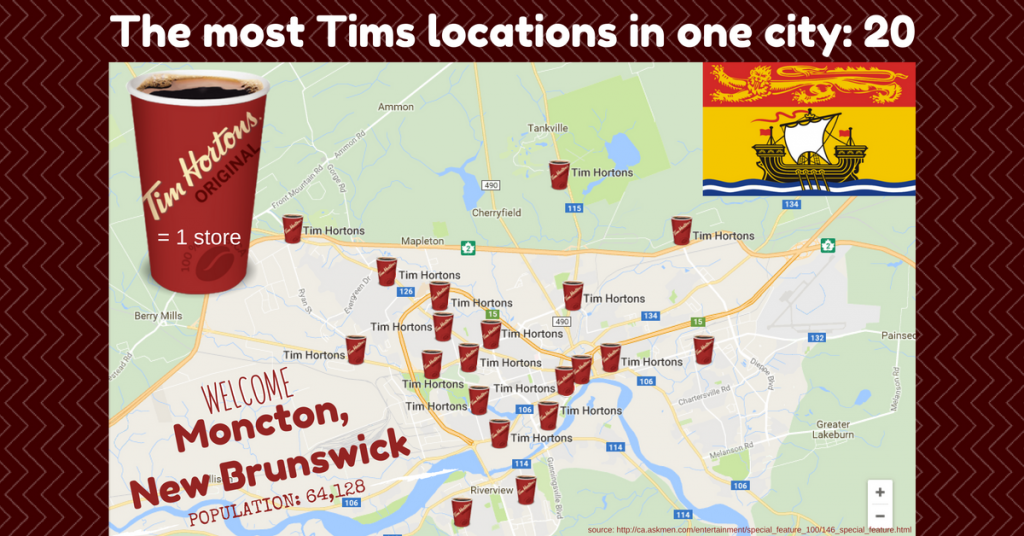
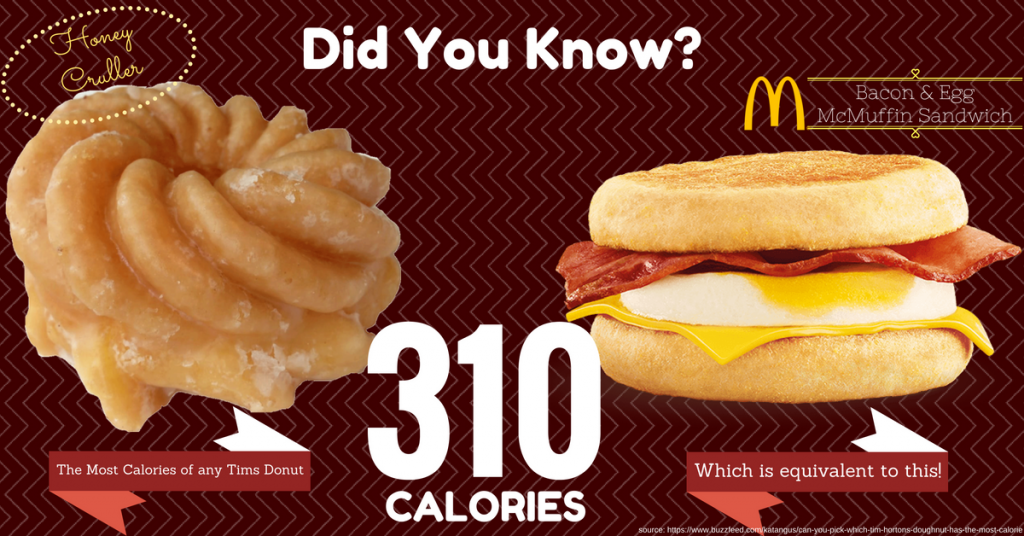
Tim Hortons Infograph 1
Tim Hortons Infograph 2
Tim Hortons Infograph 3
Tim Hortons Infograph 4
Tim Hortons Infograph 5

Resources

Doern, Bill. Visual Skills For Social Media. Seneca College. N.p., 5 Nov. 2016. Web. 31 Jan. 2017.

Maskeroni, Alfred. “Infographic: 13 Reasons Why Your Brain Craves Infographics.”Adweek. Adweek, 19 Feb. 2015. Web. 31 Jan. 2017. <http://www.adweek.com/creativity/infographic-13-reasons-why-your-brain-craves-infographics-163042/>.

“5 Reasons Why People Love Infographics.” Outreach Media. Outreach Media Group, n.d. Web. 31 Jan. 2017. <http://outreachmediagroup.com/5-reasons-why-people-love-infographics/>.

Building Digital Ads The Right Way

Image courtesy of Marketing Land

Digital Ads are Everywhere.

Whether we are on our desktop computer, laptop or mobile smartphones, we are subjected to numerous advertisements on a daily basis.  It is in our e-mails, strategically positioned throughout our social media accounts and just about everywhere you can think of.  Offline it is still prevalent. Driving to work and you see that billboard on the right hand side? Check.  Going to the washroom and using the urinal with a smoking ad right within your eye sight? Check.  Digital ads are no different, as the billion dollar industry is embracing technology and doing their best to capture our attention spans.

But let’s look at the facts…Many of us hate the constant bombardment of advertisements that are placed on our screens.  Here are some interesting stats and figures that compliment this sentiment:

– The average click through rate of display ads across all formats and placements is 0.17%
– Ad blocking grew by 41% globally in the last 12 months
– There are now 198 million active ad block users around the world
– A study revealed that only 2.8% of participants thought that ads on website were relevant
– About 60% of clicks on mobile ads are accidental
– 54% of users don’t click banner ads because they don’t trust them
– 33% of internet users find display ads completely intolerable

Digitial Ads are Annoying?

Clearly, there are a lot of bad digital ads that waste our time.  They can simply desensitize us, that program our minds to make ads a mere afterthought.  Marketers who constantly try to get our attention often fail because…they simply alienate us.  Who here is sick of Retargeted Advertising? (Put your hand up wherever you are reading this post!).  It is no secret that we as consumers will use the internet for research and opinion.  But the fact remains that we are however, more likely to talk to someone for actual feedback on a product or service.  This traditional word of mouth marketing approach has more validity in shaping our purchase decision.

Having that said, if advertisers are going to get our attention on social platforms, let’s take into consideration what is essential in building presentable digital ads on a network such as Facebook:

What Makes a Compelling Digital Ad?

Here are some good characteristics that define a successful ad:
– Click through (Is it worth you finding more about this ad?)
– Engagement (How interested are you in the ad?)
– Conversion (Will this lead you to a purchase?)
– Stop power (Did this really grab your attention?)

A highly great site I recommend for you to test your ads:
http://admocks.adparlor.com/

Be sure to always include:
– A central image
– Brand logo
– Supporting text elements

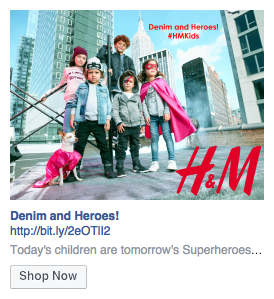
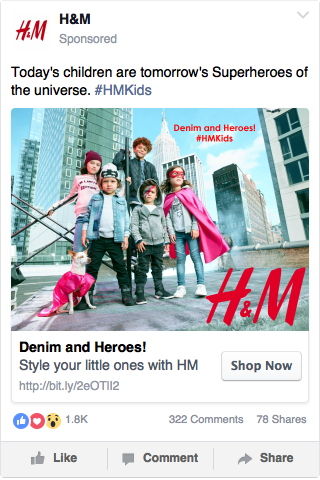
Here a few mock ads using the clothing brand H&M that I have created for example:

News feed ad size
Right hand ad size
Right hand ad size
Mobile ad size
Mobile ad size
Original image edited with Canva

Resources

“The 2015 Ad Blocking Report.” PageFair. PaigeFair Limited, 30 June 2016. Web. 31 Dec. 2016. <https://pagefair.com/blog/2015/ad-blocking-report/>.

Chaffey, Dave. “Display Advertising Clickthrough Rates.” Smart Insights. Smart Insights, 26 Apr. 2016. Web. 31 Dec. 2016. <http://www.smartinsights.com/internet-advertising/internet-advertising-analytics/display-advertising-clickthrough-rates/>.

“Digital Ad Spend Worldwide 2016.” Statista. Statista, n.d. Web. 31 Dec. 2016. <https://www.statista.com/statistics/246567/global-online-advertising-revenue/>.

Doern, Bill. Visual Skills For Social Media. Seneca College. N.p., 15 Oct. 2016. Web. 31 Dec. 2016.

Frederick, Ben. “60% Of All Mobile Banner Ad Clicks Are Accidents.” 02/04/2016. MediaPost Communications, 4 Feb. 2016. Web. 31 Dec. 2016. <http://www.mediapost.com/publications/article/268266/60-of-all-mobile-banner-ad-clicks-are-accidents.html>.

Jatain, Vishveshwar. “Ad Blockers Are Perhaps the Biggest Problem That Publishers Are Facing at the Moment, Here’s an Essential Premier on What You Need to Know about Them.” AdPushup Blog. AdPushup, 09 Oct. 2016. Web. 31 Dec. 2016. <https://www.adpushup.com/blog/5-things-publishers-need-know-ad-blockers/>.

Shemenski, Jay. “Display Advertising Is Failing. What’s Next in Digital Marketing?” Marketing And Growth Hacking. Marketing And Growth Hacking, 02 Mar. 2016. Web. 31 Dec. 2016. <https://blog.markgrowth.com/disruptive-advertising-is-failing-what-s-next-for-digital-marketing-7f391a02181#.vmoy5kl7r>.

Stec, Carly. “20 Display Advertising Stats That Demonstrate Digital Advertising’s Evolution.” HubSpot Blog Homepage. HubSpot, 25 Sept. 2015. Web. 31 Dec. 2016. <https://blog.hubspot.com/marketing/horrifying-display-advertising-stats>.

“2016 Mobile Adblocking Report.” PageFair. PaigeFair Limited, 23 Nov. 2016. Web. 31 Dec. 2016. <https://pagefair.com/blog/2016/mobile-adblocking-report/>.

How Brands can use Instagram to promote their Products

Instagram
Instagram image courtesy of Android Tipsters

Grow your business with Instagram

One of the most popular social media platforms that exists today as of this writing is Instagram.  In this day and age where we document almost everything we do…in almost every place that we journey to, the ‘Gram has a user base of over 400+ active million IG’ers worldwide.  It is clearly a smartphone favourite, with an average of 80 million photos being uploaded each day.

While Instagram serves us to archive our personal moments in time, it is a great tool for businesses to create product and brand awareness.  The video I put together focuses on footwear cleaning product Crep Protect.  I discovered this particular brand through various sneaker brand IG pages that I follow, who would continually praise their products and consistency.   It is almost the equivalent to a digital version mention in terms of word of mouth marketing.  This is really an instrumental measurement of success.  Building a powerhouse brand in a short period of time is the goal.  I was curious to see if their products lived up to the hype and needless to say, the results did deliver.

The smartphone that I used to document my Instagram video was the One Plus One, which debuted in 2014.  OPO has been praised for their low end price point.  Their cell phones are available for $3-$400 cheaper than your typical Samsung/Apple models.

The shooting techniques that I used were very straight forward for this particular video.  There are 23 filters available on Instagram.  I elected not to use any of them since this video is demonstrating a product in action. I relied on natural lighting as I was outdoors while filming.  It was mainly point and shoot, doing my best to keep the shots focusing on the cleaning agent to get the job done.   I would have liked to use a zoom in option, but I believe that feature will be probably happen down the road as they’ve introduced some long requested viewing enhancements this past year.

What’s great about Instagram video is that it allows you to pause your shots and resume recording, similar to how Vine operates.  Previous versions of IG video were only available in one continuous 15 second shot.  The recent 60 second max recording allows Instagram users to tell a better story with ample time that is not too short or too long to lose viewer interest.

Biggest Instagram Takeaway

From a business point of view, the main take away is that Instagram is a valuable resource tool for companies. It is a popular communication tool that is user friendly to use, that really helps generate interest in a product.  Especially for the sneaker culture, with the rise of blogs and in particularly Instagram itself in the last 6 years, these platforms really help curate these same users of the ‘Gram to consume more content which can lead to a buyer purchase.  It is a winning formula because consumers are always hungry for new content.  Businesses have this digital outlet to highlight upcoming releases, provide product information and create a buzz all at the same time.

Resources

Chaykowski, Kathleen. “Why Instagram Extended Its Video-Length Limit To 60 Seconds.” Forbes. Forbes Magazine, 29 Mar. 2016. Web. 27 Oct. 2016. <http://www.forbes.com/sites/kathleenchaykowski/2016/03/29/why-instagram-extended-its-video-length-limit-to-60-seconds/#8d22c483cb48

Ratcliff, Christopher. “23 Up-to-date Stats and Facts about Instagram You Need to Know.” 23 Uptodate Stats and Facts about Instagram You Need to Know Comments. ClickZ Group, 20 Apr. 2016. Web. 27 Oct. 2016. <https://searchenginewatch.com/2016/04/20/23-stats-and-facts-about-instagram/